
In today’s post, Dan goes big data. He analyzes board game projects over the last 18 months to test the common wisdom of how most project funds.
The question often comes up about how to predict your funding success based on the first 48 hours of your campaign. The common answer is that you will get 33% funding in the first 48 hours, 33% funding in the final 48 hours, and about 33% funding throughout the entire middle of your campaign. Although these numbers seem close to accurate when casually browsing campaigns, I was curious if the data actually fits this model.
To this end, I gathered data from over 200 campaigns launched in 2016 and 2017. My only criteria was that these campaign were launched in this time frame and had successfully funded. I then compiled the data from Kicktraq.com for funding in the first 2 days of being live, the final 3 days of being live, and the entire middle of the campaign. The reason I chose final 3 days is because the final 48 hour notice for a campaign will go out on the 3rd to last day of the campaign and there is usually a big spike on the 3rd to last day due to this. Since the third to last day is part of the final 48 hour timeframe I figured the final three days should be included in the end of campaign data.
Before I get into the data, I would like to say there are some variations in funding that have a wide range of reasons. Campaigns that direct marketing towards their slumps (or either end of the campaign) will see larger spikes during those times. Some games have a shorter funding period and will typically have lower middle of campaign funding due to decreased number of days live. Some games do poorly in the beginning but as they slowly fund throughout the campaign, see a large spike towards the end of the campaign due to increased backer confidence. The reasons for why there are variations are long and these should be kept in mind when looking at data of this sort.
THE OVERALL DATA ^
This chart shows all the campaigns in a stacked bar chart by the percentage of the campaign’s funding based on the three categories: first two days, middle of the campaign and final three days.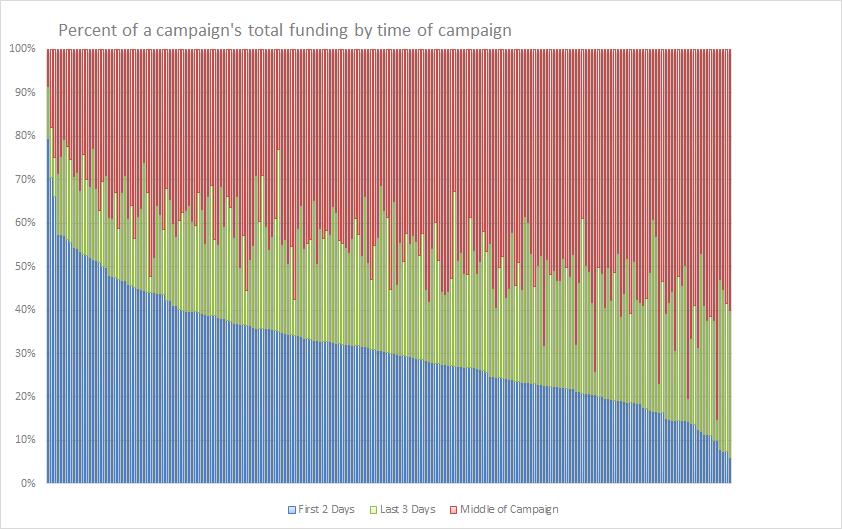
Below, you will find a closer look at each portion of the campaigns, but the overall data is as follows:

The First 2 Days of the Campaign ^
The data for the first 2 days of the campaign looks very much like we expected it to. Our running estimate was that it should be about 33% of total funding for the entire campaign. Turns out it is just 2 points below that at 31.0%.
| Average | 31.0% |
| Standard Deviation | 12.5 |
| Low | 6.0% |
| High | 79.5% |
I further broke down the data to look at the funding percentage for each campaign that I looked at.
| Percent Funding in first 2 days | Number of campaigns with this level of funding
(Out of 214 campaigns examined) |
|
| <20% | 40/214 | 19% |
| 20-29.9% | 65/214 | 30% |
| 30-39.9% | 67/214 | 31% |
| 40-49.9% | 24/214 | 11% |
| >50% | 18/214 | 8% |
As the tables show, although the average is at 31%, there is a large swing with funded campaigns getting anywhere between 6% to 79.5% of their total funding in the first two days. However, looking at the breakdown, it is clear that the bulk of the campaigns (over 60%) funded between 20-40%, with the remaining campaigns being split evenly either above or below that.
The Final 3 days of the campaign ^
The data for the final 3 days of the campaign was a little surprising to me.The common wisdom was that around 33% of funding came in the final 3 days. It turns out the average is a decent amount lower than that at 23.6% (about 10 points below expected!).
| Average | 23.6% |
| Standard Deviation | 7.6 |
| Low | 3.8% |
| High | 44.2% |
Further breaking down the data, we see much less distribution than we did in the first 2 days of funding, with the majority of campaigns being in the 20-29.9% (53% of all campaigns had this level of funding) and 30% of the campaigns received under 20% funding in the final 3 days.
| Percent Funding in final 3 days | Number of campaigns with this level of funding
(Out of 214 campaigns examined) |
|
| <20% | 63/214 | 29% |
| 20-29.9% | 112/214 | 52% |
| 30-39.9% | 33/214 | 15% |
| 40-49.9% | 6/214 | 3% |
| >50% | 0/214 | 0% |
This shows a distribution skewed far more towards the lower side of funding as compared to the first 2 days of the campaign.
The Middle of the Campaign ^
Although I was mostly concerned with examining the data of the first 2 and final 3 days of a campaign, it was easy calculating the data for the middle of the campaign as I already had all of the data, so I took a look at middle of campaign funding as well.
| Average | 45.3% |
| Standard Deviation | 11.5 |
| Low | 8.6% |
| High | 85.2% |
Again, I was expecting this to be closer to 33% and it was 12 points higher than that at 45% funding received on average in the middle of a campaign (all days between first 2 and final 3). Here is further breakdown of the data:
| Percent Funding in final 3 days | Number of campaigns with this level of funding
(Out of 214 campaigns examined) |
|
| <20% | 2/214 | 1% |
| 20-29.9% | 17/214 | 8% |
| 30-39.9% | 50/214 | 23% |
| 40-49.9% | 74/214 | 34% |
| >50% | 71/214 | 33% |
Looking at the breakdown, 67% of campaigns received more than 40% funding in the middle of the campaign, 23% received about a third of their funding in the middle, and only 9% of campaigns received less than 30% of funding in the middle of the campaign.
So what does all of this data mean? ^
I think there are a few major points that can be taken away from this. First and foremost, that old adage of “Get 30% of your funding in the first 48 hours if you want your campaign to be successful” is very true. Few campaigns that end up getting 20% or less of funding in the first 48 hours end up succeeding. However, I will say that the data does show that although rare (and unlikely), it is still possible to fund with low first day numbers. You will just need to work hard to gain backers through the middle and end of your campaign.
I also think that the data suggests that you cannot expect your final 3 days to behave exactly like your first 2 days. I always expect that in the final 48 hours I will get almost exactly what I got in the first 48 and this simply is not true. Yes, the data fluctuates and there are a decent portion of games that do receive more funding in the end of a campaign than the beginning. However, the distribution of funding in the final 3 days is far lower than the distribution for levels of funding in the first 2 days. It is far more common to get less funding in the final 3 days than you did in the first 2.
What can you gain from this data? I think the important lesson is as follows; First, look at your campaign’s first 2 days on kickstarter and multiply it by 3. If this number is NOT close to your funding goal remember two important things: 1.) you are less likely to fund BUT it is not impossible 2.) You are going to have to work your butt of to make up for your decreased funding. Luckily, after your first 2 days of your campaign, you have a lot of time left to hit the pavement and connect with potential backers to get your campaign funded!
Please reach out to me if you have any questions about the data, where it came from, and what I think about it all! Also remember that if there are ever any topics you would like me to discuss on here, please reach out to me at [email protected]
As always, thanks for reading and good luck with your campaigns!
Dan used data collected from Kicktraq.com to put together this analysis.
I would be interested to know if the point at which the project is successfully funded has any noticeable effect on the distribution of how the funding comes in. Do projects that are funded early (48hrs!) have a more steady income or do projects that are just barely funded?
Having seen Dan’s data, we’d definitely need help from Kicktraq to get that specific, but that’s a good question.
One question that does seem answerable is what campaign length does to the amount of funding. There are a number of shorter campaigns in the data set as well as some longer ones.
Any chance of getting access to that data (CSV)? I confess to being able to find no data what-so-ever when I went to the Kicktraq site. I’ll dig deeper though if it’s in there somewhere. I can think of a few other things that I’d be interested in mining from it.
Hey Aaron, that is definitely something I can try to look at with the data, though it will take some time to go through it! I definitely think the final 48 will see a bigger bump if a game did not fund early as a struggling campaign is probably more likely to have people check it later to see if it funded and when those people return to see if it is funded in the final days they will end up backing it. Already funded games will see a steady flow through most of the campaign and see higher middle of campaign funding and lower final 48 funding. This is all speculation though and not actually derived from the data.
Thanks again for reading and I will try to look at the data more closely to address your question!
Thanks Dan. It’s a good article and it’s got my brain chomping at the bit for more information. 🙂